Signed-in user scope
The Analytics drawer reads the signed-in user's saved chat rows. Users see their own aggregate usage, not every user's chat activity.
The Analytics drawer turns recorded chat usage into a model-by-model table. It helps users understand which models they have used, how many requests were sent, how long responses took, how much throughput was recorded, and how many tokens were generated.
Analytics are based on saved app usage. They are not synthetic guarantees, hardware promises, or benchmark results.
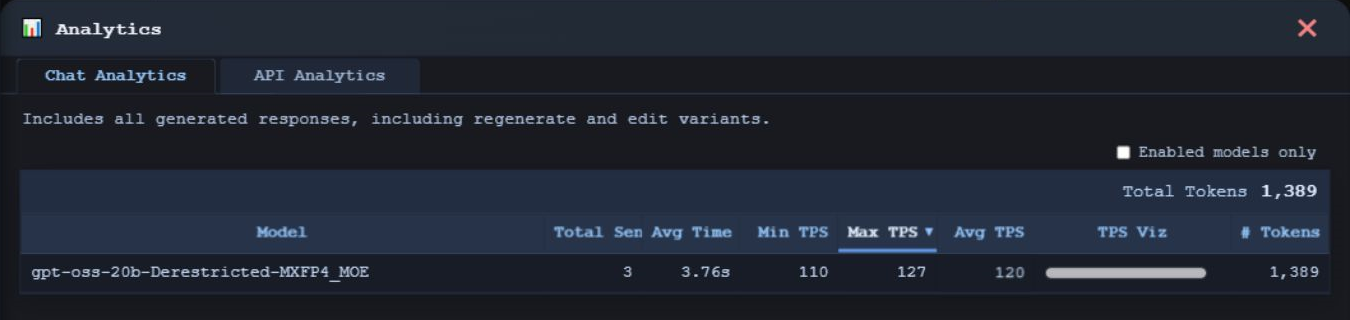
Administrators can use Enabled only to filter visible model rows using registry state. Overall totals remain unchanged. Missing measurements are not zero-performance results.
| Column | What it shows |
|---|---|
| Model | The model identity recorded with completed chat responses. |
| Total Sent | Count of recorded prompt/response rows for that model. |
| Avg Time | Average recorded response time for that model. |
| Min / Max / Avg TPS | Recorded token-per-second values from saved responses. |
| TPS Viz | A small bar visualization scaled against the highest average TPS currently in the table. |
| # Tokens | Total recorded generated tokens for that model, plus an overall token total row. |
The Analytics drawer reads the signed-in user's saved chat rows. Users see their own aggregate usage, not every user's chat activity.
The drawer includes generated responses from normal sends, regenerate actions, and edit variants when they are recorded in chat history.
The table can help compare how models have behaved during real app usage, especially response time, TPS, and token totals.
Admin tools can show token totals by user, along with saved row counts, session counts, and last recorded timestamps.
Admins can export a selected user's chats, export all chats, delete a selected user's chats, or delete all chat history through admin chat tools.
Analytics depend on the data stored by completed app interactions. Missing, old, imported, or manually changed data can affect totals. Benchmark results live in the Benchmarks drawer and are tracked separately from chat analytics.
Administrator-only API Analytics shows request counts, errors, durations, backend-reported token usage, and paginated recent request metadata.
Avg Completion Time counts completed chat-completion events with an HTTP status below 400 and a recorded duration. Failed/cancelled completions and model-discovery requests are excluded from that average.
Tracking records operational metadata, not prompts, responses, images, keys, or authorization headers. Other client/proxy logging is a separate operator concern. See API access and troubleshooting.
www.llmcontroller.comLLM Controller on GitHub